base_dir = os.path.dirname(sys.path[0])
input_dir = f"{base_dir}/data/input"
output_dir = f"{base_dir}/data/output"VR score
This computes the VR score from pluripotency and velocity metrics
Data
Load Cell x Metadata dataset, where the columns must contain a two-dimensional embedding, sample/condition and cluster metadata, as well as cellular pluripotency and trancriptomic rate of change metrics.
For the later two, we suggest using CCAT and RNA velocity vector lengths respectively.
Additional metadata layers, such as cell-cycle labels or key gene expression values, can also be added to the dataset and used for annotating the resulting landscapes in later steps, but they will not be used for the computation of VR scores.
Example Data: CRC organoids
Data from Qin & Cardoso Rodriguez et al. 2023.
Relevant information and computation parameters are stored as a dictionary.
param_dict = {
    "input_csv":"md_QinCardoso23.csv",
    "dim_names":["phate1","phate2"],
    "potency":"CCAT",
    "dynamic":"velocity_length",
    "cluster":"curatedCLUST",
    "cluster_colours":{
        "TA 1":"#FF99CC",
        "Goblet / DCS":"#CC9900",
        "Late Enterocyte":"#006600",
        "proCSC":"#000099",
        "Early Enterocyte":"#00FF99",
        "revCSC":"#CC0000",
        "ER Stress":"#CC00FF",
        "CSC":"#6666FF",
        "TA 2":"#FF6666"
        },
    "condition":"condition"
}
cell_data = pd.read_csv(f"{input_dir}/{param_dict['input_csv']}")
cell_data| phate1 | phate2 | CCAT | velocity_length | A | K | P | WENR | mac | fib | curatedCLUST | OWNsig_stemO_UCell | OWNsig_stemS_UCell | condition | |
|---|---|---|---|---|---|---|---|---|---|---|---|---|---|---|
| 0 | -0.003110 | -0.003080 | 0.274730 | 186.242097 | 0 | 0 | 0 | 0 | 0 | 0 | TA 1 | 0.000000 | 0.221648 | WT |
| 1 | 0.024983 | 0.029213 | 0.233824 | 152.058837 | 0 | 0 | 0 | 0 | 0 | 0 | Goblet / DCS | 0.000000 | 0.122389 | WT |
| 2 | 0.037142 | 0.007396 | 0.195300 | 164.789267 | 0 | 0 | 0 | 0 | 0 | 0 | Late Enterocyte | 0.000000 | 0.155778 | WT |
| 3 | -0.021990 | 0.000884 | 0.359556 | 221.681973 | 0 | 0 | 0 | 0 | 0 | 0 | proCSC | 0.013370 | 0.085037 | WT |
| 4 | 0.041909 | 0.035762 | 0.230588 | 208.885837 | 0 | 0 | 0 | 0 | 0 | 0 | Late Enterocyte | 0.000000 | 0.058852 | WT |
| ... | ... | ... | ... | ... | ... | ... | ... | ... | ... | ... | ... | ... | ... | ... |
| 5896 | -0.003300 | -0.006133 | 0.361533 | 197.806256 | 0 | 0 | 0 | 1 | 0 | 0 | TA 1 | 0.179889 | 0.337778 | WENR |
| 5897 | -0.028562 | 0.010894 | 0.443155 | 145.233683 | 0 | 0 | 0 | 1 | 0 | 0 | proCSC | 0.663185 | 0.256611 | WENR |
| 5898 | -0.002911 | -0.009425 | 0.392001 | 188.500721 | 0 | 0 | 0 | 1 | 0 | 0 | CSC | 0.136074 | 0.283296 | WENR |
| 5899 | -0.024535 | 0.002836 | 0.441813 | 114.664223 | 0 | 0 | 0 | 1 | 0 | 0 | proCSC | 0.298593 | 0.203278 | WENR |
| 5900 | -0.013252 | 0.004670 | 0.434362 | 191.966684 | 0 | 0 | 0 | 1 | 0 | 0 | revCSC | 0.512222 | 0.388148 | WENR |
5901 rows × 14 columns
fig, axs = plt.subplots(2,2)
fig.suptitle("Pluripotency and transcriptomic change on 2D space")
axs[0,0].scatter(
    cell_data[param_dict["dim_names"][0]],
    cell_data[param_dict["dim_names"][1]],
    c=cell_data[param_dict["cluster"]].map(param_dict["cluster_colours"]))
axs[0,1].scatter(
    cell_data[param_dict["dim_names"][0]],
    cell_data[param_dict["dim_names"][1]])
axs[1,0].scatter(
    cell_data[param_dict["dim_names"][0]],
    cell_data[param_dict["dim_names"][1]],
    c=cell_data[param_dict["potency"]], cmap="inferno")
axs[1,1].scatter(
    cell_data[param_dict["dim_names"][0]],
    cell_data[param_dict["dim_names"][1]],
    c=cell_data[param_dict["dynamic"]], cmap="inferno")
<matplotlib.collections.PathCollection>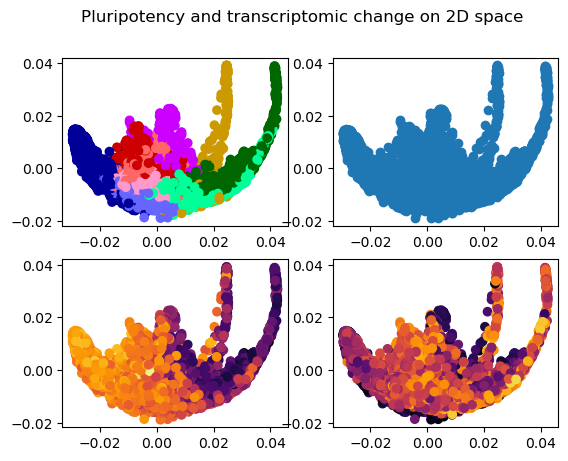
Data pre-processing
check_inversevvl
check_inversevvl (dataframe, param_dict)
Computes inverse of RNA velocity vector lengths if those are being used as the dynamic metric (i.e. param_dict[“dynamic]==“velocity_length”).
| Type | Details | |
|---|---|---|
| dataframe | Input Cell x Meta pandas dataframe | |
| param_dict | Parameter dictionary with “dynamic” key set. | |
| Returns | dict | Updated parameter dictionary with “inverse_vvl” set as the default dynamic metric. |
cell_data, param_dict = check_inversevvl(cell_data, param_dict)Computing the inverse of the RNA velocity valuesscale_metrics
scale_metrics (dataframe, metrics=['CCAT', 'inverse_vvl'])
Scales key metrics from the dataframe to a (0,1) range.
| Type | Default | Details | |
|---|---|---|---|
| dataframe | Input Cell x Meta pandas dataframe | ||
| metrics | list | [‘CCAT’, ‘inverse_vvl’] | Metrics to scale. Should be found within the dataframe’s columns. |
| Returns | pandas.DataFrame | Updated Cell X Metadata dataframe with scaled metrics (in-place) |
cell_data = scale_metrics(cell_data, [param_dict["potency"],
param_dict["dynamic"]])cell_data| phate1 | phate2 | CCAT | velocity_length | A | K | P | WENR | mac | fib | curatedCLUST | OWNsig_stemO_UCell | OWNsig_stemS_UCell | condition | inverse_vvl | |
|---|---|---|---|---|---|---|---|---|---|---|---|---|---|---|---|
| 0 | -0.003110 | -0.003080 | 0.339365 | 186.242097 | 0 | 0 | 0 | 0 | 0 | 0 | TA 1 | 0.000000 | 0.221648 | WT | 0.147660 |
| 1 | 0.024983 | 0.029213 | 0.217284 | 152.058837 | 0 | 0 | 0 | 0 | 0 | 0 | Goblet / DCS | 0.000000 | 0.122389 | WT | 0.231605 |
| 2 | 0.037142 | 0.007396 | 0.102314 | 164.789267 | 0 | 0 | 0 | 0 | 0 | 0 | Late Enterocyte | 0.000000 | 0.155778 | WT | 0.196273 |
| 3 | -0.021990 | 0.000884 | 0.592517 | 221.681973 | 0 | 0 | 0 | 0 | 0 | 0 | proCSC | 0.013370 | 0.085037 | WT | 0.087964 |
| 4 | 0.041909 | 0.035762 | 0.207627 | 208.885837 | 0 | 0 | 0 | 0 | 0 | 0 | Late Enterocyte | 0.000000 | 0.058852 | WT | 0.107182 |
| ... | ... | ... | ... | ... | ... | ... | ... | ... | ... | ... | ... | ... | ... | ... | ... |
| 5896 | -0.003300 | -0.006133 | 0.598417 | 197.806256 | 0 | 0 | 0 | 1 | 0 | 0 | TA 1 | 0.179889 | 0.337778 | WENR | 0.125830 |
| 5897 | -0.028562 | 0.010894 | 0.842009 | 145.233683 | 0 | 0 | 0 | 1 | 0 | 0 | proCSC | 0.663185 | 0.256611 | WENR | 0.253098 |
| 5898 | -0.002911 | -0.009425 | 0.689346 | 188.500721 | 0 | 0 | 0 | 1 | 0 | 0 | CSC | 0.136074 | 0.283296 | WENR | 0.143186 |
| 5899 | -0.024535 | 0.002836 | 0.838003 | 114.664223 | 0 | 0 | 0 | 1 | 0 | 0 | proCSC | 0.298593 | 0.203278 | WENR | 0.380759 |
| 5900 | -0.013252 | 0.004670 | 0.815766 | 191.966684 | 0 | 0 | 0 | 1 | 0 | 0 | revCSC | 0.512222 | 0.388148 | WENR | 0.136525 |
5901 rows × 15 columns
Compute VR scores
Here we split by necessary variables and compute VR score
compute_distdeg
 compute_distdeg (input_df, dim_name=['phate1', 'phate2'],
                  split_by='curatedCLUST', knn=30,
                  distance_mode='centroid', distance_metric='manhattan',
                  scale=True, plot=False, rmv_outliers=False)
Computes distances and degrees of cells within a cluster. Results will get scaled within the cluster level so it handles them as independent entities.
| Type | Default | Details | |
|---|---|---|---|
| input_df | |||
| dim_name | list | [‘phate1’, ‘phate2’] | |
| split_by | str | curatedCLUST | |
| knn | int | 30 | |
| distance_mode | str | centroid | |
| distance_metric | str | manhattan | |
| scale | bool | True | |
| plot | bool | False | |
| rmv_outliers | bool | False | |
| Returns | pandas.DataFrame | Dataframe |
bycluster_median
bycluster_median (dataframe, param_dict)
Compute median of potency and dynamic metrics on a per-cluster basis.
| Type | Details | |
|---|---|---|
| dataframe | Input Cell x Meta pandas dataframe | |
| param_dict | Parameter dictionary with “potency”, “dynamic”, and “cluster” keys set. | |
| Returns | pandas.DataFrame | Updated Cell X Metadata dataframe with median metrics. |
compute_vr_scores
compute_vr_scores (dataframe, param_dict, global_dist=False)
Compute the Valley-Ridge scores.
| Type | Default | Details | |
|---|---|---|---|
| dataframe | Input Cell x Meta pandas dataframe | ||
| param_dict | Parameter dictionary with “potency” and “dynamic” keys set. | ||
| global_dist | bool | False | |
| Returns | pandas.DataFrame | Dataframe |
score_data = compute_vr_scores(cell_data, param_dict, global_dist=True)fig = make_subplots(
rows=2, cols=2,
specs=[
[{"type": "scatter3d"}, {"type": "scatter3d"}],
[{"type": "scatter3d"}, {"type": "scatter3d"}]],
)
fig.add_trace(
go.Scatter3d(
x=score_data[score_data["condition"]=="WT"][param_dict["dim_names"][0]],
y=score_data[score_data["condition"]=="WT"][param_dict["dim_names"][1]],
z=score_data[score_data["condition"]=="WT"]["VR"],
mode="markers", marker=dict(
color=score_data[score_data["condition"]=="WT"][param_dict["cluster"]].map(param_dict["cluster_colours"]))
),
row=1, col=1)
fig.add_trace(
go.Scatter3d(
x=score_data[score_data["condition"]=="WTfib"][param_dict["dim_names"][0]],
y=score_data[score_data["condition"]=="WTfib"][param_dict["dim_names"][1]],
z=score_data[score_data["condition"]=="WTfib"]["VR"],
mode="markers", marker=dict(
color=score_data[score_data["condition"]=="WTfib"][param_dict["cluster"]].map(param_dict["cluster_colours"]))
),
row=1, col=2)
fig.add_trace(
go.Scatter3d(
x=score_data[score_data["condition"]=="CRC"][param_dict["dim_names"][0]],
y=score_data[score_data["condition"]=="CRC"][param_dict["dim_names"][1]],
z=score_data[score_data["condition"]=="CRC"]["VR"],
mode="markers", marker=dict(
color=score_data[score_data["condition"]=="CRC"][param_dict["cluster"]].map(param_dict["cluster_colours"]))
),
row=2, col=1)
fig.add_trace(
go.Scatter3d(
x=score_data[score_data["condition"]=="WENR"][param_dict["dim_names"][0]],
y=score_data[score_data["condition"]=="WENR"][param_dict["dim_names"][1]],
z=score_data[score_data["condition"]=="WENR"]["VR"],
mode="markers", marker=dict(
color=score_data[score_data["condition"]=="WENR"][param_dict["cluster"]].map(param_dict["cluster_colours"]))
),
row=2, col=2)
fig.update_traces(marker_size = 2)
fig.update_layout(
autosize=True,
scene_aspectmode="cube",
width=1000, height=1000,
margin=dict(l=50, r=50, b=50, t=90))
fig.show()The resulting VR score dataset can be saved to a file:
And so can the dictionary with parameters, to be used in subsequent steps:
param_dict["scores_csv"] = "vr_QinCardoso23.csv"with open(f"{output_dir}/param_dict.json", "w") as param_json:
json.dump(param_dict, param_json)score_data.to_csv(f"{output_dir}/{param_dict['scores_csv']}", index=False)Unit tests will be implemented in the future once the alphashape-based distance computation is finished.
# test_eq()